Seasonal Climate Outlook Message for February to May 2016
The monthly value of the Southern Oscillation Index (SOI) fell from -10.1 in December to -21.8 in January. According to the SOI Phase system, the SOI is in a ‘Rapidly Falling’ phase.
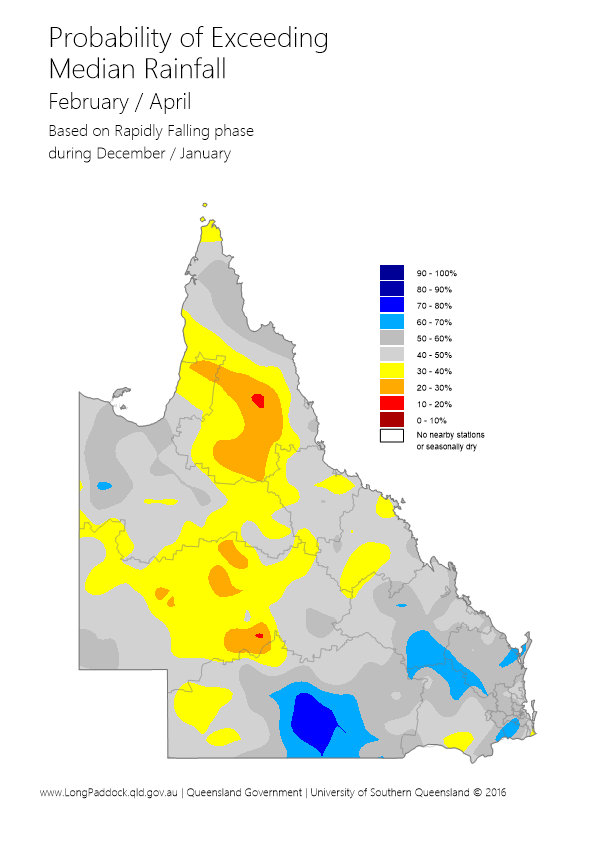
A map showing the probability of above-median rainfall for the next three-month period (February to April) is available. This map is based on previous years from 1900 to 1998 which, like 2016, had a rapidly falling SOI over December and January (i.e. 1905, 1912, 1928, 1933, 1946, 1955, 1958, 1961, 1969, 1970, 1971 and 1998). This map indicates a 30 to 50 per cent probability of above-median rainfall for much of Queensland with a higher than normal probability of above-median rainfall in parts of southern Queensland. However, it is difficult to draw meaningful statistics from a selection of only 12 years.
Rather than track the SOI over summer, the Department of Science, Information Technology and Innovation (DSITI) bases its monthly climate statements, over the summer period, on conditions leading up to summer, including the state of the El Niño–Southern Oscillation (ENSO) phenomenon prior to summer, and on factors which alter the impact of ENSO on Queensland rainfall (i.e. the more slowly changing extra-tropical sea surface temperature (SST) pattern in the Pacific Ocean). The DSITI Monthly Climate Statement for February 2016 is available.
When using a climate outlook it should be remembered that the probability, or per cent chance, of something occurring is just that – a probability. For example, if there is a 70 per cent probability of above-median rainfall, then there is also a 30 per cent chance of below-median rainfall. It does not mean that rainfall will be 70 per cent more than the median.
Users should note that the SOI is less reliable as an indicator of rainfall for the autumn season. Furthermore, while climate outlook schemes cannot provide outlooks with absolute certainty, users who follow a skilful scheme should benefit from doing so in the long-term. Thus, users should consider the historical track record of any scheme, and such information is becoming increasingly available.
