Frequently Asked Questions
The number of stations recording data has varied considerably throughout history. Our summary information shows the evolution of the station network over time, as well as the spatial distribution of stations on selected dates. Users wishing to conduct a detailed analysis should download the interpolation log files. These files can also be used to determine which stations were used to construct the gridded raster for a specific variable and date.
You can use the API to search for stations within a given radius of a known station. To obtain a list of the patched stations you could search for stations within a 10,000km radius of Alice Springs Post Office (station 15540):
https://www.longpaddock.qld.gov.au/cgi-bin/silo/PatchedPointDataset.php?format=near&station=15540&radius=10000
- the system is being used fairly (i.e. excessive requests by one user are not preventing other users from obtaining data)
- we can continue to provide the service free of charge.
If you find your data requests are being blocked, you may be able to mirror the datasets you are interested in. If mirroring is not a suitable solution, please contact us so we can discuss your needs.
SILO provides point datasets at approximately 8000 station locations and approximately 280,000 grid cell locations (i.e. all cells which are over land).
When selecting stations on our web interface, you may find that some stations appear to be missing. While data are available for all 8000 stations, only those stations which meet the specified "data quality" criteria are shown. You can adjust these criteria using the buttons and slider bars below the map. For example:
-
to show all stations with rainfall data, regardless of how much observed data each station has, you should select the option for including "Rainfall", deselect the options for including "Temperature" and "Class A pan evaporation", and set the "Percent observed" to zero.
-
to show all stations which have 90% observed data for Rainfall and Temperature in the 1980s and 1990s, you should select the options for including "Rainfall" and "Temperature", deselect the option for including "Class A pan evaporation", set the "Percent observed" to 90% and set the "Decades of interest" to 1980-2000. This will limit the stations to those having observed data for rainfall, minimum temperature and maximum temperature, for 90% of the days between 1 Jan 1980 and 31 Dec 1999 (inclusive).
The time-series data at a given grid cell should be the same as the data extracted from a time-series of gridded surfaces at the same location. Differences can arise when the gridded values are considered suspect and replaced by long term daily mean values.
When a point dataset is requested at a grid cell location, the data are:
- extracted from the relevant grid cell in the gridded datasets
- passed through a simple filter that checks if each datum is within an acceptable range:
- daily rainfall: 0 – 1300 mm
- maximum temperature: -9 - 54 ᵒC
- minimum temperature: -20 - 40 ᵒC
- class A pan evaporation: 0 - 35 mm
- solar radiation: 0 - 35 MJ/m2
- vapour pressure: 0 - 43.2 hPa
- maximum temperature > minimum temperature
If a given datum (or pair of data values for the Tmax > Tmin check) fails the check, it (or they) may be erroneous. In this situation SILO provides the long term daily mean(s) instead of the suspect value(s). A source code is provided in many of the file formats provided by SILO; the source code indicates the source of each datum and thereby enables users to identify when the aforementioned substitutions have occurred.
The same checks are done when a point dataset is requested at a station location; the main difference is observed data are provided where possible, and gridded data are provided if observed data are not available on a given day(s).
No. All SILO data products are now available through our self-service website in a range of formats.
No, you do not need an account to access SILO data.
You must provide a valid email address when requesting point datasets via our website or API.
SILO requires your email address so we can contact you: (i) if there are problems with the way SILO is being accessed; or (ii) to provide critical information such as updates to datasets or system failures.
We will only use your information for this purpose. It will otherwise not be used or disclosed unless authorised or required by law. Your personal information will be handled in accordance with the Information Privacy Act 2009. For further information, please see our Privacy Statement.
Point datasets are temporal datasets at a single location. In other words, they provide a time-series of data (usually daily time-step) at either a single grid cell or a single station.
Gridded datasets are spatial datasets for a given date. SILO grids cover the region 112°E to 154°E, 10°S to 44°S with resolution 0.05° longitude by 0.05° latitude (approximately 5 km × 5 km).
Station point datasets are a time series of data at a station location, consisting of station records which have been supplemented by interpolated estimates when observed data are missing. Station point datasets are available at approximately 8,000 station locations around Australia. These datasets were formerly known as SILO Patched Point datasets.
Grid point datasets are a time series of data at a grid point location consisting entirely of interpolated estimates. The data are taken from our gridded datasets and are available at any grid point over the land area of Australia (including some islands). The nominal grid location (where the interpolated surface is evaluated) is the centre of the corresponding grid cell. These datasets were formerly known as SILO Data Drill datasets.
Both datasets are still available, but as they can now be requested through the same interface, the distinction between them is no longer required. For further information, see the previous question.
The comparison format is intended for people to use to decide what data they need, so when new variables are added to Silo they are included in the comparison format.
Point datasets at grid locations consist entirely of interpolated data. Point datasets at station locations contain observed data (when available) and interpolated data (when observed data are not available or do not pass Quality Assurance tests).
There are many open source and commercial tools available for working with NetCDF rasters. You might find the following tools helpful:
- Viewing: Ferret, Panoply and GIS tools such as QGIS.
- Command line manipulation: NCO and CDO.
- Programming APIs: Python NetCDF4 and native NetCDF libraries for C, C++ and FORTRAN.
For most daily climate variables the observations are recorded at 9 am. To assist in understanding how SILO datasets are constructed, it may be useful to see how data are assigned to a given day:
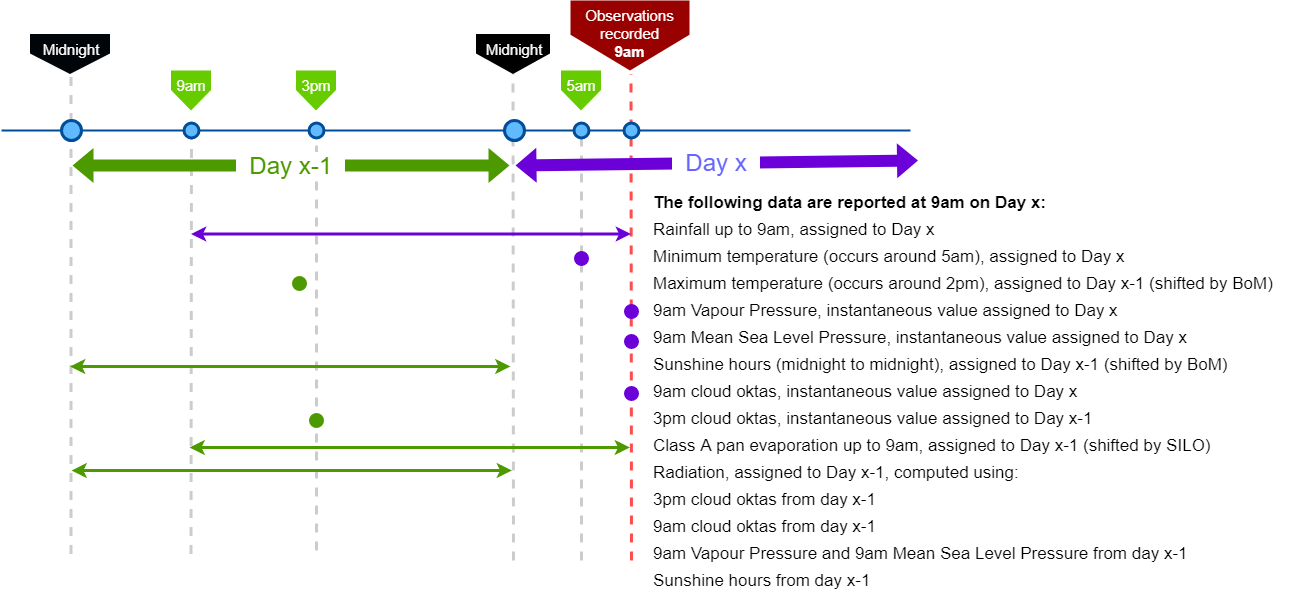
Evaporation (class A pan) is measured at 9am. In normal circumstances a large proportion of the observed evaporation would have occurred throughout the daylight hours (after 9am) on the previous day. Consequently, SILO shifts evaporation data to the day before the observation was made. Please note the adjustment is only applied to SILO’s point datasets; the day shift is not applied to SILO’s gridded evaporation datasets.
Note: the Bureau of Meteorology shifts maximum temperature data to the previous day for similar reasons. SILO uses the shifted temperature data provided by the Bureau.
Daily rainfall gridded datasets are derived from interpolated monthly rainfall by partitioning the monthly total onto individual days. Partitioning requires estimation of the daily distribution throughout the month. The distribution is obtained by direct interpolation of daily rainfall data throughout the month. At the end of the month, the interpolated monthly rainfall is then partitioned onto individual days according to the computed distribution.
For further information, please read the journal article which documents many of SILO's processes, and also our metadata.
No, data can only be requested for one location when using the website to order data. If you wish to request data for a large number of locations, you may wish to consider using our API.
If you wish to repeat a previous request or automate requests, we suggest you try our API rather than manually entering requests via the interactive web page.
Yes. Under the Gregorian calendar 2000 was a leap year, but 1900 wasn't. Normally if the year can be evenly divided by 100 it is not a leap year, however it is a leap year if it can be evenly divided by 400.
The nominal location for a given grid cell is the centre of the cell. For example, the value at 115.05° East, 34.00° South is intended to be representative of the area 115.025° - 115.075° East, 33.975° - 34.025° South.
You can request data for any grid cell that is not masked out. Grid cells over the ocean and some islands are masked out. If you request data at a location where the longitude or latitude is not a multiple of 0.05°, the location will be rounded to the nearest 0.05°. If you request data at a location that lies exactly on the edge of a grid cell, the longitude (or latitude) will be rounded up giving you data from the grid cell that is east of the cell edge (if the specified longitude lies on a cell edge), or north of the cell edge (if the specified latitude lies on a cell edge).
No. The accuracy of the interpolated datasets is strongly dependent on the density of the input data (i.e. station density). In most regions the station density is not high enough to support higher resolution estimates.
Users should also note that the interpolated estimates are based on observations recorded in a standard Stephenson screen or equivalent, placed in an open and usually flat area. It does not represent the ground level climate of some areas (e.g. wooded systems) and does not address all the issues associated with slope and aspect. Users may need to implement their own microclimate adjustments.
The number of stations recording climate variables significantly increased around 1957 – the International Geophysical Year. An anomaly interpolation technique is used to interpolate maximum and minimum temperature, radiation and vapour pressure for all years prior to 1957. The anomaly method is better able to interpolate sparse datasets than direct interpolation because much of the variance can be captured by the long term mean. The anomaly method works as follows: (i) the anomaly at each station is computed by subtracting the long term daily mean (for the given station and variable) from each observed value; (ii) the anomaly data are interpolated using a smoothing spline; (iii) at each pixel the interpolated long term daily mean (for the given variable) is added to the interpolated anomaly. To further improve the interpolation, SILO uses "support" values to support the spline in data sparse regions. The support values are set to zero (i.e. the anomalies are zero at all support locations), so the resulting gridded dataset will be similar to the long term mean in the vicinity of each support value.
The data quality throughout the pre-1957 period was examined in: Rayner, D.P., Moodie, K.B., Beswick, A.R., Clarkson, N.M., and Hutchinson, R.L. (2004), New Australian daily historical climate surfaces using CLIMARC. Queensland Department of Natural Resources, Mines and Energy Report QNRME04247. Available here.
SILO datasets are constructed from observational data collected by the Bureau of Meteorology. The Bureau has a quality assurance program which is progressively checking its observational collection. SILO does not use data which have been quality checked by the Bureau and classified as "wrong", "suspect" or "inconsistent with other known information". In addition, SILO implements a number of internal checks to identify data which may be erroneous. For example, SILO uses a "two-pass" interpolation technique to interpolate all variables except daily rainfall. Observed data are interpolated in a first pass and residuals computed for all data points. The residual is the difference between the observed and interpolated values. Data points with high residuals may be indicative of erroneous data and are excluded from a subsequent interpolation which generates the final surface from which the station-point datasets are constructed.
No. Maximum temperature observations are shifted to the previous day (see above), so the observed maximum should always be lower than (or equal to) the minimum temperature.
The observed data for a given station should be similar to the corresponding interpolated data at the nearest grid cell. However differences can arise for several reasons:
- interpolated data are evaluated at the centre of the grid cell. If the station is a significant distance from the cell centre, and the interpolated surface exhibits a strong gradient in the area, there can be a significant difference between the value at the station and the cell centre. For example, under normal conditions the temperature usually decreases with elevation at approximately 5-7 °C/km. If the elevation at the cell centre is 500m higher than the station (quite possible in alpine regions), the temperature at the cell centre could be 2.5-3.0 °C lower than the temperature at the station.
- most of SILO's interpolated grids are constructed using a smoothing spline. If the input data are spatially homogeneous, the fitted surface will generally pass through (i.e. reproduce) the input data. However if the input data are highly variable or contain errors, the spline may smooth the data and consequently the fitted surface will not reproduce the input data in the affected area(s). Note: SILO uses kriging to interpolate daily and monthly rainfall. Kriging guarantees the input data are reproduced.
- SILO uses a "two-pass" interpolation technique to interpolate all variables except daily rainfall. Data rejected in the first pass are excluded from the dataset used to construct the interpolated grid in the second pass. Consequently, if a given datum has been rejected by SILO's interpolation system, the fitted surface may differ substantially from the observed datum at that location. Users should note that data rejected by the interpolation system are included in the point (station) datasets and can be identified by their source flag. Users wishing to exclude such observations can replace them with interpolated estimates by requesting the corresponding data at the nearest grid cell.
SILO data are not intended for use in climate change detection studies. Small data movements caused by climate change can be easily be confounded by changes resulting from instrumental biases and relocating recording stations. For climate change detection we recommend using the Bureau's ACORN-SAT and High-Quality datasets.
The gridded datasets are stored on Amazon Web Services' Public Data repository in an S3 bucket. The files can be mirrored using the AWS command line utilities for working with S3 datasets. For example, the monthly rainfall rasters can be mirrored to your current directory using the sync command:
aws s3 sync s3://silo-open-data/annual/monthly_rain/ .
SILO’s point datasets at station locations can be mirrored using the procedure described on our mirroring page. If this approach is not suitable for your application, you may be able to use our API (it is designed for repetitive or automated tasks).
SILO’s point datasets at grid cell locations cannot be easily mirrored because:
- there would be a large number of files, approximately 290,000 (one for each grid cell over land).
- every raster file (i.e. NetCDF or GeoTiff file containing gridded data) can change every day, although changes usually only occur in grids for the most recent 12 months. (Data can change for a variety of reasons; see the next question below).
If you need to mirror point datasets at grid cell locations, you should consider building your own point datasets from our gridded datasets. The desired point datasets can be built by extracting the relevant pixel values from a time-series of gridded datasets. The gridded data can be efficiently downloaded because they are arranged in annual blocks, with each annual file containing all of the grids for the selected year and variable. Please note this approach is not possible if you are seeking point datasets at station locations.
If you need to mirror any SILO dataset, please consider:
- mirroring data for only those locations and variables that you really need.
- an incremental approach. For example, you could occasionally download data for the entire time period required (e.g. every six months to capture major changes to the data), and frequently update only the most recent 3 months of each dataset (e.g. every week to capture nightly changes to the data).
Please remember SILO data are provided free of charge under the Queensland Government's Open Data program. In addition to the operational cost of maintaining the system, SILO also pays data egress charges for the data downloaded by our clients. We therefore ask you to carefully consider your data requirements before downloading large volumes of point data.
SILO data are constantly evolving. The changes can be a result of changes in the raw data or changes in SILO methodology. Recent datasets grow rapidly as new observational data are added (while some stations report in real-time, it may be many months or even years until data are received from all stations). The data are also subject to corrections and updates by the Bureau, so there can be ongoing changes to the raw data used to construct SILO datasets.
SILO actively seeks techniques for improving data quality and may implement changes which modify our interpolated estimates or derived variables. Users requiring static datasets (e.g. for model calibration) should archive their own copy of the data, as they should not rely on SILO supplying exactly the same dataset at different points in time.
SILO is updated every night with new data from the Bureau of Meteorology. The update commences at 9:30 pm (AEST) and is usually completed by midnight.
Yes. Metadata are included in the NetCDF and GeoTiff gridded datasets, and formal metadata are provided on our metadata page.
The data must be in a format that Excel can recognise. When requesting point data in:
- a customised format, you should select the CSV (comma-separated values) option. Excel will be able to read the .csv file directly.
- one of the fixed (i.e. predefined) formats, the data are delivered as plain ASCII text. To import the data into Excel:
- In the ‘File Menu’, select 'Open'
- In the pop-up window, change the file filter (in the bottom-right corner) from ‘All Excel Files’ to ‘All Files’
- Select the SILO data file and click on ‘Open’
- In the ‘Text Import Wizard’ pop-up window, select ‘Delimited’ and click on ‘Next’
- Select 'Space' in the list of delimiters and click on ‘Next’
- Click ‘Finish’ to load the dataset.
The regular array of grid points is only shown when the map resolution is high enough to display them. You can either: (i) zoom in to the region of interest until the grid points automatically appear. They will appear when the scale is 3km or less (the scale is shown in the bottom left corner of the map); or (ii) enter the latitude and longitude of the location you require in the search box. The map will automatically shift focus to that location and show the grid points.
The number of stations reporting Class A pan observations has declined in recent years:
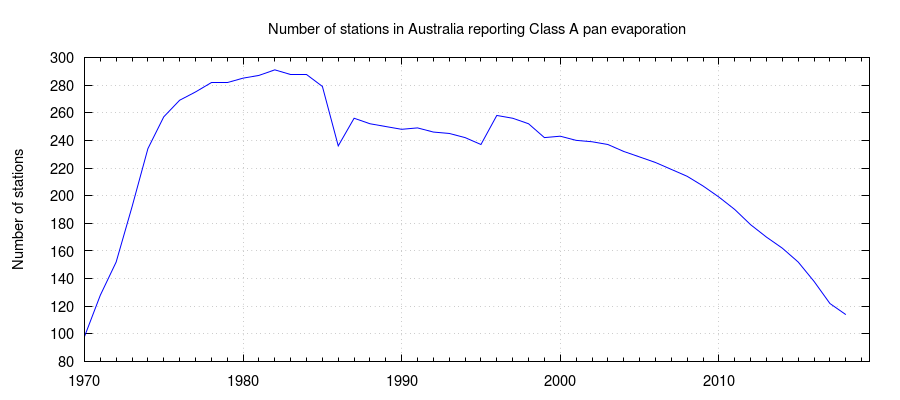
The accuracy of an interpolated raster is strongly influenced by the number of observations that were used to construct it. Consequently we expect SILO’s Class A pan evaporation rasters to be declining in accuracy and therefore recommend clients consider using alternatives, such as our synthetic estimate. For further information, please read our evapotranspiration documentation.
Class A pan evaporation observations are available from some stations in near real-time, while it may take a few months before the data from other stations are available. This has consequences for the accuracy of the most recent rasters, because the quality of an interpolated raster depends on the number of observations used to construct it. The delay between when a Class A pan measurement was recorded and when it becomes available for inclusion in SILO’s rasters is shown in the Table below.
| Days/months after observation date | Number of reports* |
| 2 days | 50-55 |
| 0 to 2 months | 55-60 |
| 3 months | 80-85 |
| 4 months | 95-115 |
Given the limited number of stations used to construct the most recent Class A pan evaporation rasters, we recommend clients consider using the alternatives outlined in our evapotranspiration documentation.
Trends can arise for a range of reasons, but the two most common reasons are:
- climate change
- systematic drift in instruments used to record data.
Discontinuities can arise for many reasons, such as:
- a change in the type of device used to record a given climate variable
- a recording station may have been relocated a short distance
- the environment around a given station may have changed (e.g. tree growth)
- the methods used by SILO may change (users should note that different algorithms are used for constructing datasets in the years before 1970 (evaporation) and 1957 (most of our “core” variables). For further information, please see our overview of SILO processes, and SILO’s primary reference.
